
America’s water system is already deep into its replacement cycle
The U.S. water network is enormous: ASCE says it includes more than 2.2 million miles of underground drinking water pipes and more than 16,000 wastewater treatment plants. That scale matters because aging at this size does not show up as one dramatic collapse. It shows up as a long, expensive replacement cycle that utilities are already trying to manage.
The pressure is not abstract. A 2023 Utah State University study of more than 800 water providers found that drinking water systems in the U.S. and Canada experience about 260,000
water main breaks each year, at an estimated $2.6 billion in annual repair and maintenance costs.
That is a water main breaks about every two minutes across the United States.
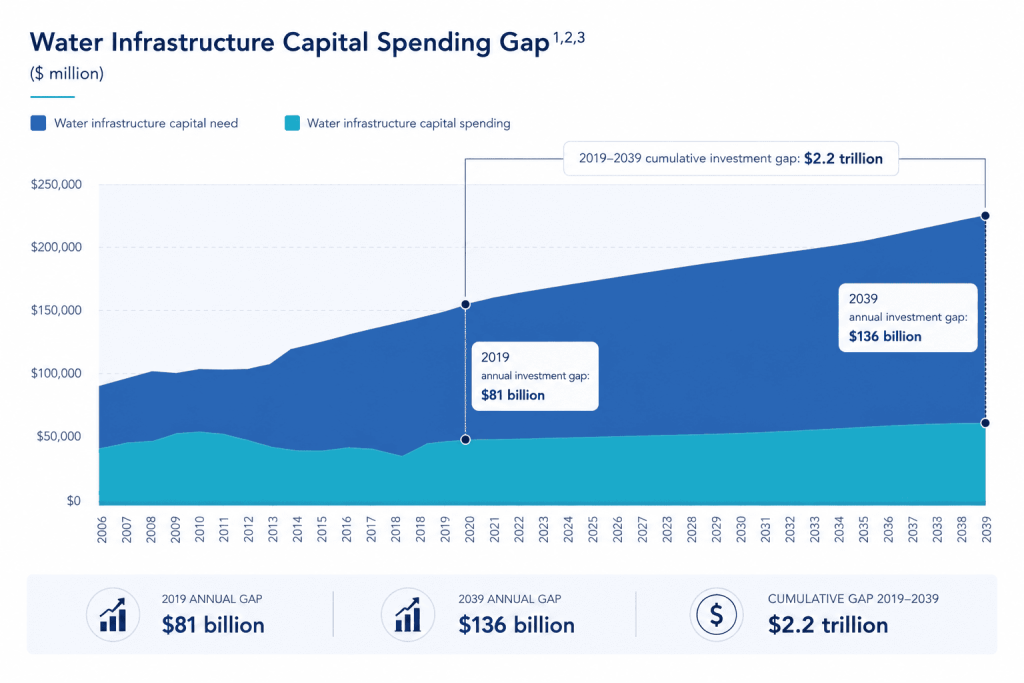
According to ASCE and the US Water Alliance, in 2019 total capital spending on water infrastructure fell $81 billion short of the capital need and on current trends, that annual gap will grow to $136 billion by 2039
The Crisis Looks Different Depending on Where You Look
What makes this opportunity more interesting is that the infrastructure problem looks different depending on where you are. Some regions carry huge total pipe mileage, which means a large absolute replacement market. Others are extremely pipe-dense, which creates more interdependence and less room for failure. And in many rural areas, the burden is high relative to population, which leaves smaller utilities carrying too much infrastructure with too few resources.
The point is simple: vendors that treat all utilities the same will miss the real buying patterns.
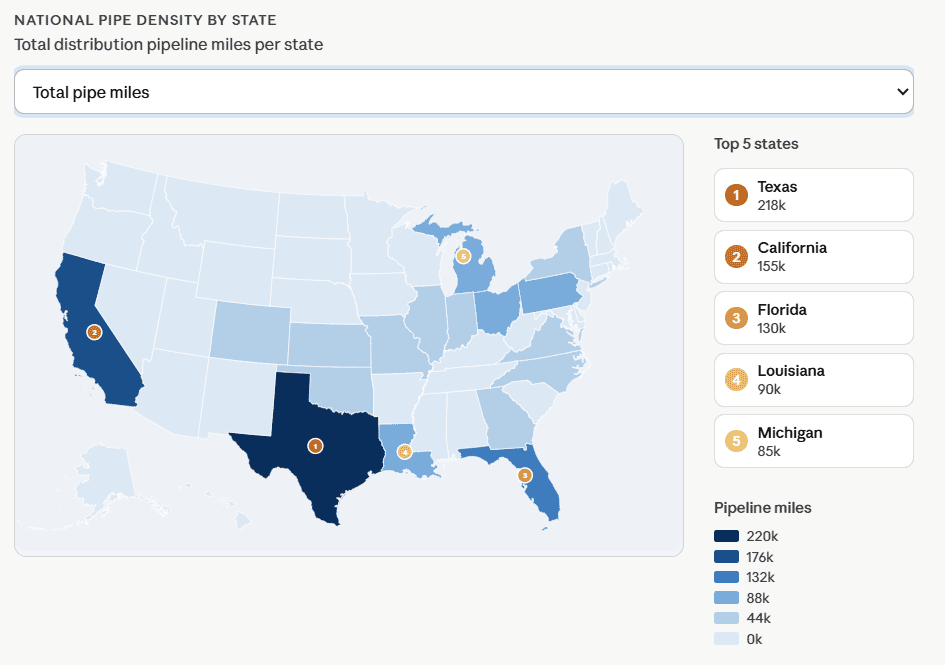
Figure 1 Highlights where the largest absolute replacement markets are likely to emerge. States such as Texas, California, and Florida carry some of the highest total pipe mileage in the country, meaning even a modest rise in failure rates could translate into massive infrastructure replacement demand over the next decade.
Source: Aquaintel
But total volume alone does not define infrastructure risk.
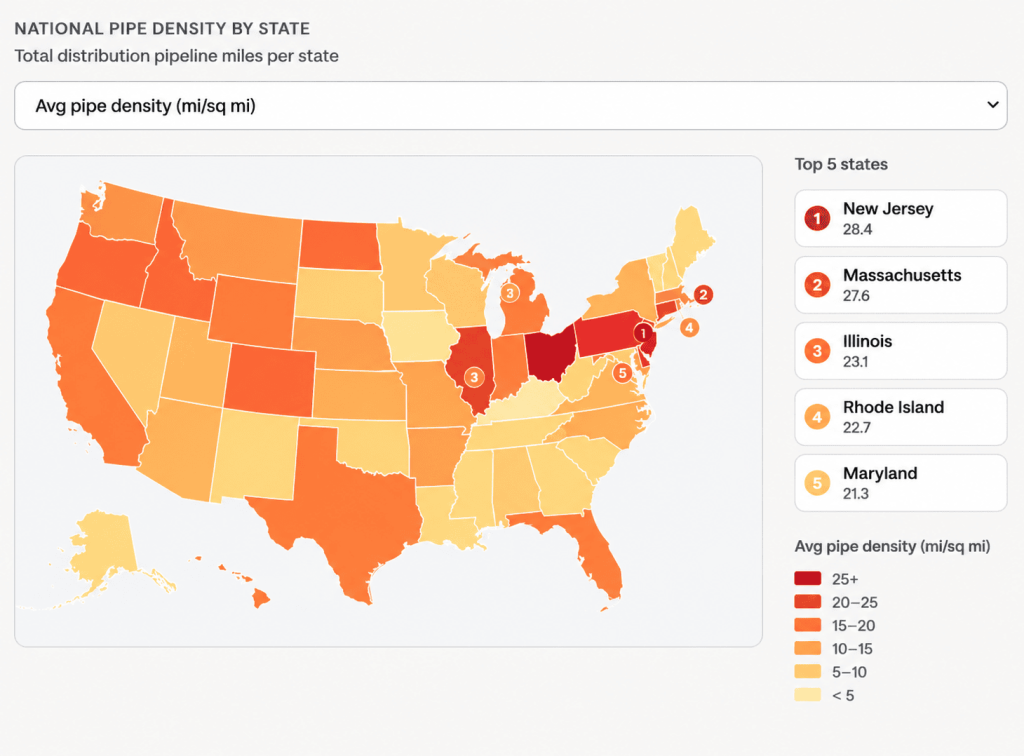
Figure 2 shows that many Northeastern and Midwestern states operate with significantly higher pipe density per square mile. These systems are more tightly interconnected, leaving utilities with less redundancy and a smaller margin for failure as aging assets begin to deteriorate.
Source: Aquaintel
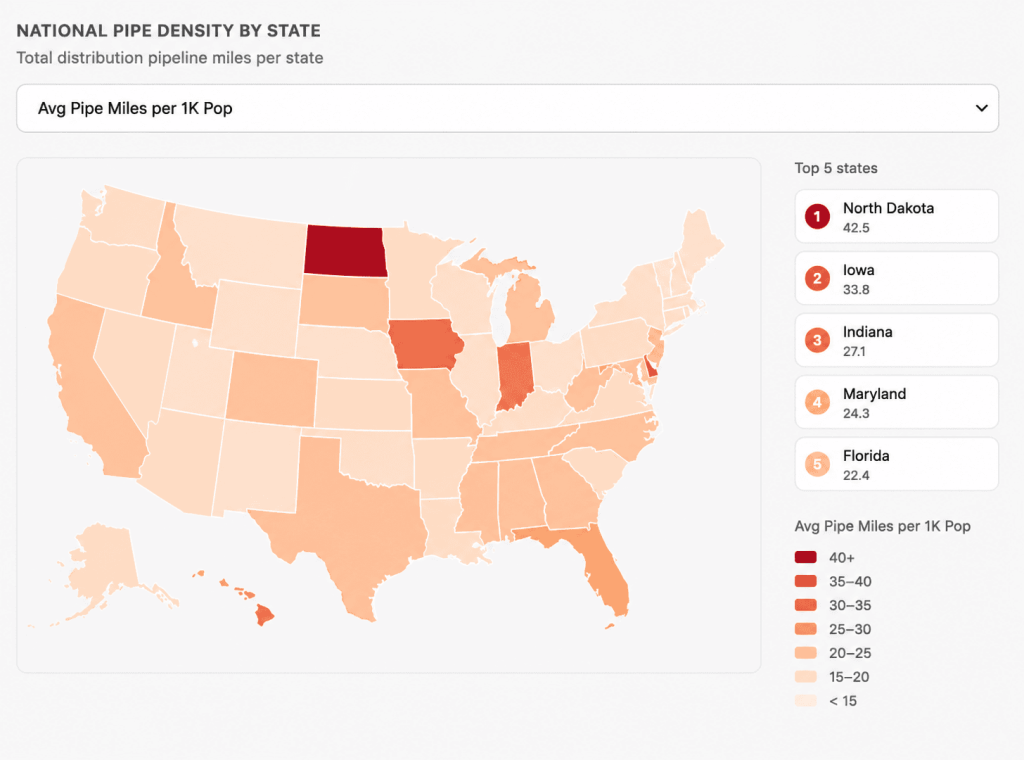
Figure 3 adds another layer to the challenge. Several rural and lower-population states maintain disproportionately high pipe mileage per capita, despite having smaller utilities and more limited budgets. In these regions, the burden of maintaining aging infrastructure falls on fewer ratepayers and leaner operational teams, making long-term replacement planning significantly harder.
Source: Aquaintel
Utilities do not replace assets all at once
Utilities usually do not wake up one day and decide to replace a pipe, pump, or treatment component. The process builds slowly. Maintenance costs rise, reliability drops, and teams begin watching the asset more closely. That is the first sign that a reactive repair model is no longer enough.
Then the outside pressure arrives. New rules, permit renewals, and compliance deadlines can turn an aging asset into an urgent replacement need. In Connecticut alone, utilities are now accelerating lead pipe replacement after new federal rules required systems to identify and replace lead service lines within ten years. The state recently received $27.5 million in federal funding to support the transition. (CT Insider)
Once that happens, the money conversation starts. Capital plans are updated, engineering studies begin, and utilities look for financing through grants, revolving funds, or rate actions. The EPA’s 7th Drinking Water Infrastructure Needs Survey estimates that U.S. drinking water systems need $625 billion over 20 years for pipe replacement, treatment upgrades, storage, and other key assets. (US EPA)
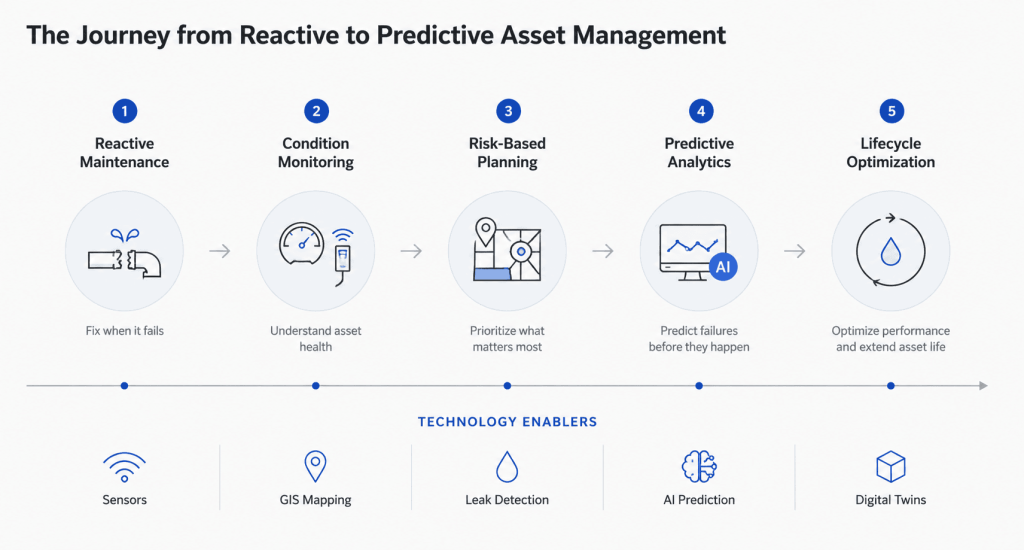
This is why reactive maintenance is giving way to predictive asset management
The bigger shift is not just replacement. It is how utilities think about replacement. Even the EPA has increasingly pushed utilities toward asset management frameworks that prioritize planned maintenance, lifecycle evaluation, and proactive replacement planning over emergency repair cycles and that is exactly where the market is moving: from fixing failures after they happen to predicting which assets are most likely to fail next. (US EPA)
That shift is already being supported by technology. Public research and EPA materials point to a growing use of tools such as leak detection, asset mapping, and decision support systems to help utilities identify risk earlier and prioritize renewal work more intelligently. In practice, that means utilities are increasingly asking not just “what broke?” but “what will break first, and what should we replace before it fails?” (EPA NERL)
For vendors, that changes the job. The best vendors are no longer just selling equipment at the end of a procurement cycle. They are helping utilities understand the problem earlier, build the business case sooner, and shape the replacement plan before the RFP is written. That is the difference between being a bidder and being part of the decision.
What smart vendors should do now
The best opportunity is not to talk to every utility in the same way. It is to segment the market. Dense Northeastern systems will care about interdependence and service risk. Fast-growing regions will care about expansion and capacity. Rural systems will care about stretching limited budgets and reducing emergency repairs. That is why geography, asset condition, and budget timing all matter together.
If a vendor can identify which utilities are entering the replacement window, what triggered the change, and how far along the decision process they are, it can engage much earlier and much more effectively. In a market where a water main breaks every two minutes and repair costs keep climbing, early visibility is not just helpful. It is the edge.
The real window is before procurement starts
This is the part most vendors miss. By the time an RFP appears, the utility has usually already moved through maintenance pressure, planning, budgeting, and internal alignment. The decision is often nearly made; procurement is just the formal last step.
This isn’t just intuition — it shows up in win rates. Across public-sector procurement, vendors who engage before a solicitation is published see win rates near 60%, compared to roughly 45% for those who wait for the RFP.
That is why the next wave of winners in U.S. water infrastructure will not be the companies that wait for the bid. They will be the ones that understand the replacement cycle, read the signals early, and help utilities move from reactive repair to predictive planning. The market is already moving. The question is whether vendors are moving early enough to keep up.
If you found this article valuable, you might also enjoy “The Next $50 Billion in Water Infrastructure Won’t Go to the Best Technology”, where we take a deeper look at another challenge shaping the future of water utilities and what it means for vendors.