
The water sector has been infamous for never having moved fast enough in terms of technology. Water infrastructure functions on 50-year asset lifecycles, serves a public that expects near-perfect reliability, and relies on budgets approved by elected officials.
The tolerance for risk is minimal by design, but several forces have converged simultaneously: infrastructure built in the post-war boom is hitting end-of-life all at once, climate stress is making supply and demand less predictable, EPA is tightening regulations on contaminants that utilities weren’t previously monitoring, and a generation of experienced operators is retiring faster than they can be replaced.
The result is an industry under more pressure than it has faced in decades, and increasingly turning to digital intelligence to manage it.
The numbers reflect this: The U.S. digital water market was approximately $8 billion in 2024, growing at roughly 8% annually. That’s roughly three to four times the pace of traditional water infrastructure spending. North American utilities are likely to have invested $169.5 billion in digital water solutions between 2024 and 2033. For an industry known for slow adoption, these figures certainly point towards a real structural shift instead of a standard cycle that was bound to happen
The Data Problem That Predates the Solutions
Understanding where intelligence platforms add value requires understanding the data problem they’re solving. Without it, you’re hoping for a standardized approach to work out in a market that favors precision and targeted undertakings over anything, bringing in anything but the good.
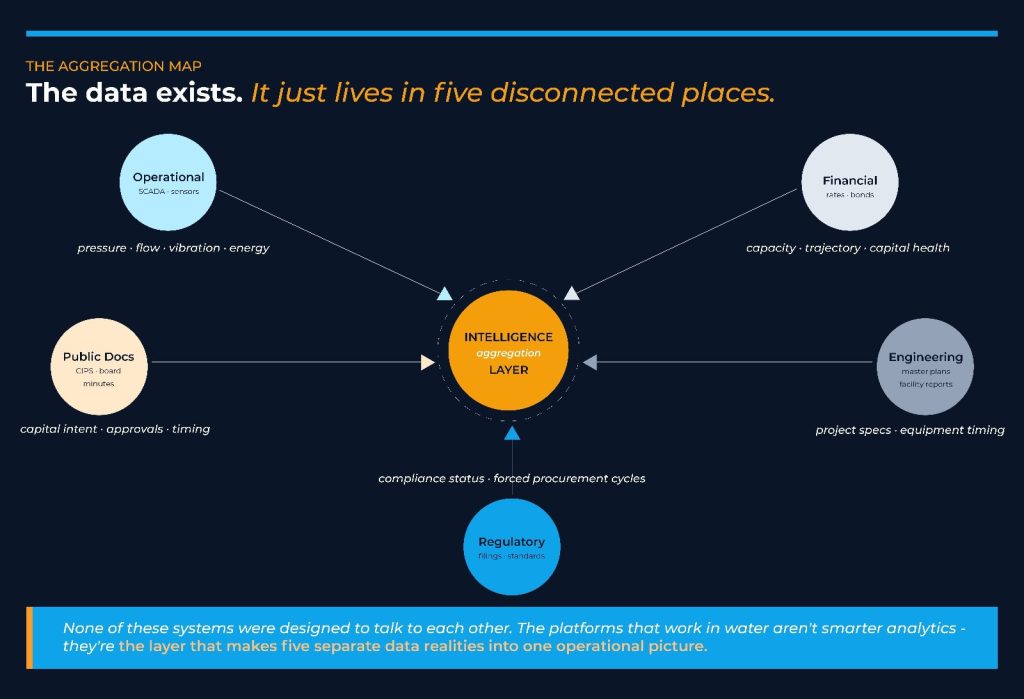
Water utilities generate an enormous amount of operational data, SCADA systems, IoT sensors, water quality testing, maintenance logs, energy consumption records. They also interact with a substantial amount of external data: funding applications, regulatory filings, capital improvement plans, board minutes, engineering reports. None of this was designed to be integrated. Most of it lives in incompatible systems, some of it on paper, spread across departments that have historically had little reason to share information with each other.
Intelligence platforms address this by aggregating from sources that previously possessed little to no connection.
Operational data streams in real time from SCADA systems and sensors such as pressure readings, flow rates, pump performance, chemical dosage, energy consumption.
Financial information, including rate structures, bond prospectuses, and funding applications, gets analysed for fiscal health and capital capacity.
Public documents such as capital improvement plans, board meeting minutes, regulatory filings etc get processed automatically for relevant signals tend to reveal a lot more than one might realise.
Engineering plans and facility master reports yield project timing and equipment specifications while regulatory records track compliance status and flag evolving requirements.
This aggregation is now feasible at scale partly because baseline digital infrastructure is nearly universal. Over 63% of recent projects funded through the Clean Water State Revolving Fund included SCADA upgrades, according to EPA data. Advanced metering infrastructure and automated meter reading are standard at most mid-to-large utilities. The raw data exists but it is only through appropriate platforms that can make this accessible and open to analysis.
From Data to Intelligence
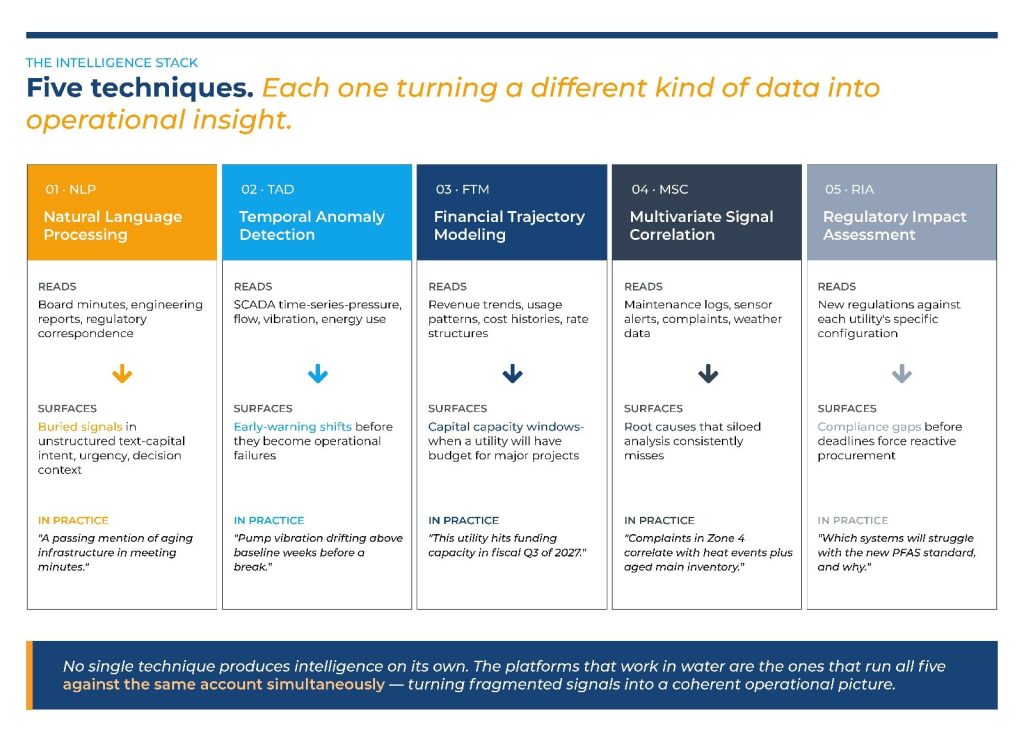
Turning aggregated data into operational insight doesn’t happen automatically as it is reliant on several specific techniques working at the same time together. Some of these are:
Natural Language Processing (NLP)
NLP works through disorganised texts such as board meeting transcripts, engineering reports, regulatory correspondence and extracts relevant signals that would otherwise take staff hours to find manually. It can assist in identifying these systematically:
- A passing mention of aging infrastructure in meeting minutes
- A capital budget line item for treatment plant upgrades
- An engineer’s note about pressure anomalies in a distribution zone
Temporal Anomaly Detection
In Temporal Anomaly Detection, changes in the normal operation of systems through time-series data analysis reveal anomalies that serve as early warnings about impending system failures, such as pressure decreases and unusual pump vibrations.
Financial Trajectory Modeling
This projects future capital capacity by assessing: Revenue trends, Usage patterns and even Cost histories.
The result is visibility into when and where a utility will have a budget available for major projects. Information which is valuable for utilities engaged in long-term planning, and equally valuable for vendors trying to time their outreach.
Multivariate Signal Correlation
This links patterns across different data sources.
- Maintenance records get cross-referenced with sensor alerts
- Customer complaint patterns get mapped against weather events and system conditions
Cross-system analysis like this is capable of surfacing root causes that siloed analysis consistently misses.
Regulatory Impact Assessment
Algorithms review new regulations and compare them with each utility’s specific setup to spot potential compliance issues early. For example, they can identify which water systems might have difficulty meeting a new PFAS standard, helping teams prepare and respond proactively rather than being caught off guard.
Decision Mapping: What Most Vendors Miss
Knowing when a capital project is set to arrive is necessary, but knowing who actually makes the decision, and who shapes it before the formal process begins, is precisely what turns a prospect into a win.
Leading platforms now map utility decision ecosystems in ways that go considerably beyond org charts. Organisational structures get extracted from public records and documents, but the analysis extends to identifying which individuals and committees have historically driven capital decisions, not just who holds formal authority. Historical procurement patterns reveal which external relationships carry weight in the process.
For vendors, this intelligence answers the question that frustrates most sales efforts: why did we lose a deal we thought we were well-positioned for? Often the answer involves relationships or internal dynamics that were not visible from the outside. Decision mapping makes them visible.
For utilities, the same analysis can reveal bottlenecks in their own decision processes, coordination gaps between departments, decision velocity issues, structural reasons that good projects take longer than they should to advance.
Timing Matters And Here’s Why
Water main breaks exceed 260,000 per year. Regulatory mandates on lead, PFAS, and cybersecurity are creating forced procurement cycles that utilities cannot defer.
In this environment, the competitive advantage in vendor sales increasingly belongs to companies who identify emerging projects during the planning phases, when utilities are still developing budgets and writing specifications, rather than responding to published RFPs when the real decisions have already been made.
Intelligence platforms are what make that early-stage visibility possible at scale.